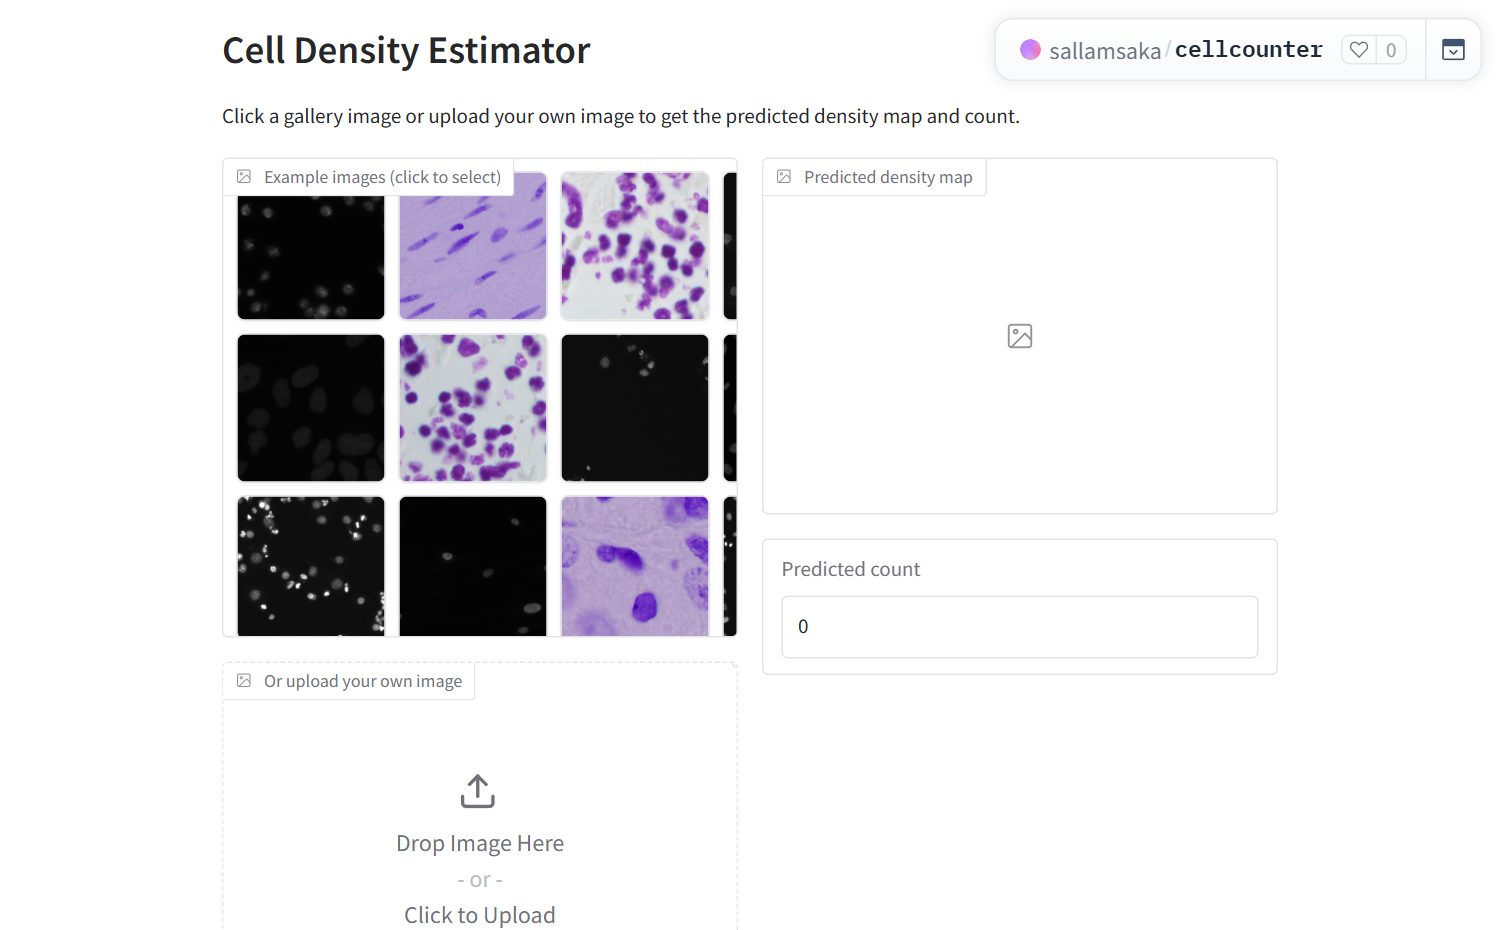
Cellcounter predicts a cell density map from microscopy images using a U-Net model, and a total cell count from the sum of the density map.
The web app. The input is an image, preferably an actual microscopy image. The output is a predicted density map and a predicted cell count.
Method. A U-Net style CNN trained to output a density map, in PyTorch. The training data is the 2018 Data Science Bowl nuclei dataset from Kaggle: 80% of the stage1 training data for training and 20% for validation.
For label construction, for each cell mask I computed a centroid and placed a normalized Gaussian around each centroid, so that each cell mask image array sums to one and the sum of all cell masks is the total number of cells.
The training set was doubled with contrast-inverted images, and training was performed on cropped out 256x256 patches of images to cover each image. The loss incorporated pixel-level value deviation from the target density, the shape of the predicted densities at different scales, and absolute error of total counts. At inference it is sliding-window prediction on 256x256 patches, then the patches are stitched into a full-image density map.
Results. I also compared a count-only training loss against a multi-term one.
| loss | patch MAE | full-image MAE |
|---|---|---|
| count only | 2.615 | 6.366 |
| pixel + shape + count | 3.021 | 5.209 |
Count-only training did slightly better on patches, but the multi-term loss produced better full-image behaviour after stitching, probably due to the spatial information provided by the predicted density.
Limitations. The model performs best on cells that contrast well with the background and on uniform cell sizes and appearance. It struggles with overlapping or crowded cells, large variation in cell size, low contrast images, variation in the transparency of cells, and colourful or complex looking cells.